

Executive summary
Using the Census Bureau’s Annual Business Survey (ABS) data on employer firms (those that have at least one employee), this third installment of Brookings Metro’s series of reports on Black-owned businesses focuses on the overall state of those firms across U.S. metropolitan areas. These reports are in support of the Path to 15|55 initiative, which endeavors to transition 15% of Black-owned sole proprietorships into employer firms, adding $55 billion to the U.S. economy. The ABS data, collected in 2020, allows for an in-depth analysis of employer firms during the initial stages of the pandemic. In addition, this report places a spotlight on employer firms owned by Black women. We find that:
In 2020, Black people represented 14.2% of all Americans but only 2.4% of all employer-firm owners. Latino or Hispanic people represented 18.7% of the population and 6.5% of employer-firm owners, while Asian Americans represented 6% of the population and 10.6% of employer-firm owners.1 From 2019 to 2020, Black-owned businesses grew by 6,351 firms, or 4.72%—behind Latino or Hispanic (8.19%) and Asian American (5.33%) firms, but above white-owned businesses, which shrunk by 0.9%.
Black business growth was trending upward before the COVID-19 pandemic. From 2017 to 2020, the number of Black-owned businesses across the country increased by 13.64%—larger than all businesses in general, which increased by 0.53% over the same period. Black-owned firms brought in an estimated $141.1 billion in gross revenue in 2020—an 11% increase since 2017.
More so than other racial groups, Black-owned businesses had pronounced increases in revenue, employees, and payroll. In 2020, Black business owners employed 1.321 million people, and created 48,549 new jobs—adding an additional $1.7 billion in aggregate payroll to the U.S. economy.
If Black business ownership continues to grow at its current rate (4.72%), it will take 256 years to reach parity with the share of Black people in America—a timeline that leaves racial wealth gaps entrenched. Reaching parity in 15 years would take a 74.4% growth rate; for 25 years, a 44.6% growth rate; and for 50 years, a 22.3% growth rate.
The 10 metro areas with the highest proportional representation of Black-owned businesses are all in the Southeast, including three in North Carolina. However, in 2020, as in previous survey years, no metro area had a share of Black employer firms equal to or greater than its share of Black residents.
Despite the impacts of COVID-19, from 2017 to 2020, the number of employer businesses owned by Black women rose to 52,374—encompassing 37.2% of all Black-owned businesses and representing an increase of 1.41 percentage points. However, though Black women accounted for about 7% of the total U.S. population and 13.9% of American women in 2020, they only owned 0.91% of all businesses and 4.23% of women-owned businesses.
A comparatively substantial portion (37.9%) of all Black women business owners have an advanced degree, including 19.1% with master’s degrees. This is more than 10 percentage points higher than the national average of 23.5%.
Though far from equitable, the rate of business ownership for Black women is growing rapidly. Black-women-owned employer businesses increased by 18.14% between 2017 and 2020—outpacing women-owned businesses (9.06%) and Black-owned businesses (13.64%). These trends parallel the growth in small sole-proprietor businesses owned by Black and Latino or Hispanic women. However, the extent to which this growth rate is the result of structural changes in the business and lending sectors that have made room for more inclusive growth is questionable. A closer evaluation of these trends could help develop more intentional strategies to uplift these businesses and promote further growth.
Introduction
The COVID-19 pandemic and protests stemming from the murder of George Floyd put a spotlight on Black wealth, health, and overall well-being. The social crises illuminated connections between attitudes that lead to a disproportionate number of stops, arrests, and convictions among Black Americans, as well as the underinvestment in Black businesses. Amid nationwide shutdowns, Black businesses felt significant pain, as they were less likely to obtain federal COVID-19 relief loans.
After Floyd’s death, America’s 50 largest public companies collectively pledged $49.5 billion to address racial inequality. (According to a Washington Post analysis, 90% of those commitments were loans or investments the corporations could profit from.) While many of those dollars focused on saving and developing Black-owned businesses, broader federal relief funds seemed to enhance Black business ownership. The National Bureau of Economic Research found correlations between a surge of new businesses in Black neighborhoods from 2019 to 2020 and the first two rounds of pandemic relief checks.
Similarly, federal and state bodies are investing in businesses owned by people of color. The Biden administration has signed executive orders to strengthen racial equity and support underserved communities, with a focus on economic justice. This has included initiatives to ensure 50% or more of federal contracting dollars are awarded to small, disadvantaged businesses by 2025, as well as the establishment of racial equity committees to address disparities in financial inclusion and access to capital, among other areas.
Intentional and passive investments in Black businesses during the pandemic might forge a pathway for future development efforts—or it may prove to be an anomaly that cannot be replicated. There are strong signs that racialized gaps are closing; for example, unemployment disparities between Black and white Americans have lessened since 2010, while the aggregate unemployment rate for Black Americans (5%) is now as low as its pre-pandemic rate, and down from 9.9% in April 2021. Still, Black unemployment is higher than the national rate (3.5% as of March 2023).
Given the extent of racial wealth and prosperity disparities, the rate of progress is slow. While racial wealth gaps have narrowed slightly since 2013, income inequality has ballooned, with increasing gaps between the poorest and wealthiest households. For example, the highest-income white households have seen the largest growth in wealth—75 times that of lower-income families and 195 times the wealth of the median low-income Black family. These wealth inequalities have implications for rates of racial and ethnic representation in business ownership, and threaten to undermine progress on Black-owned businesses.
This report focuses on the state of businesses owned and run by Black people between 2017 and 2020. One key finding pertains to Black women, who are one of the nation’s most underserved groups, with the lowest proportional democratic representation and the largest median income gap for full-time workers. However, amid a rise in Black-owned businesses, increases in Black women founders seemed to drive overall growth. This report provides an analysis of this rise in business ownership among Black women and what it means for equity in business ownership in America.
Recent trends show a rise in Black-owned businesses
In 2020, Black people represented 14.2% of all Americans but accounted for 2.4% of all employer-firm owners. Table 1 shows this is in comparison to Latino or Hispanic Americans (18.7% of the population and 6.5% of employer-firm owners), Asian Americans (6% of the population, 10.6% of employer-firm owners), and white Americans (61.6% of the population, 82.67% of employer-firm owners).
The underrepresentation of Black and brown business ownership represents a substantial obstacle for progress toward developing a racially inclusive economy in the U.S. Black businesses are important—not only to restore the value that racism has extracted from Black communities and households, but also for the strength of our national and local economies. A lack of Black-owned employer businesses constrains economic growth and stymies opportunities for investment and inclusive development, especially in our most diverse cities and regions.
Between 2010 and 2020, the share of the minority population (those not identifying as white alone) has grown from 36.3% to 42.4%, with the number of Americans identifying as two or more races more than tripling. Yet the rate of minority-owned businesses has grown at a much slower pace, meaning there is a widening gap between population share and business representation. This gap has real implications for the state of the U.S. economy and the extent to which all people can benefit from it. However, there are signs of progress.
Between 2017 and 2020, the number of Black-owned businesses increased by 13.64%—larger than the increase in all businesses combined, which was 0.53% over the same period. The average yearly growth rate in the number of Black-owned businesses during this time was 4.2%, which is more than 20 times the overall business growth rate of 0.18%. Black-owned business growth was greatest between 2018 and 2019, when it rose by 8%; it declined to 4.7% between 2019 and 2020, likely representing the pandemic’s early impacts on foreclosure rates and investment decisions. Still, Black-owned firms brought in an estimated $141.1 billion in gross revenue in 2020—an 11% increase since 2017.
If Black business ownership continues to grow at a rate of 4.2%, it will take 256 years to reach parity with the percentage of Black people in America—a timeline that leaves racial wealth gaps entrenched. Reaching parity in 15 years would take a 74.4% growth rate; for 25 years, a 44.6% growth rate; and for 50 years, a 22.3% growth rate.
Black-owned businesses were resilient to the pandemic’s impact on revenue and closure rates. Figure 2 shows that from 2019 to 2020, the number of Black owned businesses is estimated to have grown by 6,351, or 4.7%—well above white-owned employer firms (which shrunk by 0.9%), but behind Latino or Hispanic-owned employer firms (which grew by 8.2%) and Asian American-owned employer firms (5.3%). Over the same period, Black-owned businesses increased their proportional share of employees and revenue by a greater extent: Between 2019 and 2020, Black business owners employed more than 1.32 million people, adding 48,549 new jobs and an additional $1.7 billion in aggregate payroll to the U.S. economy.
Black business ownership continued to grow in the South, with weaker trends in other metro areas
This report updates the 2022 report’s metro-level data visualization, estimating the impacts to the U.S. economy if the proportion of Black-owned employer business in a metro area matched the Black population share. The ABS cannot accurately capture information on race and ethnicity in each survey year, so to provide a more complete picture of metro areas, this interactive includes data from across all survey years as well as the most recent 2020 data.
@import url(https://c24215cec6c97b637db6-9c0895f07c3474f6636f95b6bf3db172.ssl.cf1.rackcdn.com/interactives/2023/black-businesses/app.css);
What if Black businesses reached parity with all businesses?
Select a metro area
Table 2 shows that the top 10 metro areas with the highest proportional representation of Black-owned firms are all in the Southeast, including three in North Carolina alone. Atlanta had the highest representation in 2020 at 7.42%, followed by Washington, D.C., Virginia Beach, Va., Columbus, Ga., Memphis, Tenn., and Richmond, Va. As noted above, the most recent data excludes some key metro areas; looking across all data from 2017 to 2020, Fayetteville, N.C. continues to have the highest representation of Black business ownership of all metro areas, at over 11%.
Table 3 shows that larger cities—including New York, Washington, D.C., Chicago, and Los Angeles—had higher absolute numbers of Black-owned businesses. Several of these, including New York, Chicago, and Dallas, are the nation’s largest Black and Latino-majority cities, with nearly equal proportions of Black and Latino or Hispanic residents.
 Table 4 lists the top 10 metro areas by the ratio of Black businesses to Black residents. It shows that most of the areas that are closest to achieving parity (a Black business ownership rate equal to the share of Black residents in the metro area) tend to have smaller numbers of Black-owned businesses. The top three—Portland, Maine; Fresno, Calif.; and Santa Rosa, Calif.—all have fewer than 300 Black-owned employer firms across their entire metro areas. Metro areas with larger Black populations—such as Washington, D.C. and St. Louis—are outliers, having high numbers of both Black residents and Black-owned employer businesses.
Despite substantial growth in the number of Black-owned businesses, their share is still far behind parity with the percentage of Black residents across all metro areas. While philanthropic and policy attention is increasingly focused on racial equity, this has not always translated to more equitable rates of business ownership. For example, innovation economies in Pennsylvania and Pittsburgh have struggled to make diversity and inclusion a core component of investments in the business environment.
In 2020, as in previous survey years, no metro area had proportional representation in Black business ownership. Figure 3 shows that areas with smaller Black populations tended to have better proportional representation; for example, Portland, Maine has a 2.85% Black population share and a 1.09% Black business ownership rate.
As the number of Black residents in a metro area increases, the business ownership gap also tends to increase. Figure 3 orders all metro areas surveyed in the ABS from 2017 to 2020 by the percentage share of the Black population, beginning with Albany, Ga. at 54% and ending with Boulder, Colo. at 1.8%. The graph demonstrates that metro areas with the highest shares of Black residents also tend to be the most unequal in terms of business ownership representation. In other words, despite a better opportunity for investment in Black communities, regions with a higher percentage of Black residents do not see those opportunities realized as employer businesses.
Figure 4 shows this same data as a scatter plot. The orange, yellow, and red lines indicate how far away a city is from parity. Fayetteville, N.C., and St. Louis, for example, have high Black representation and some of the most equal Black business representation rates of all metro areas. Most metro areas, including Memphis, Tenn., and Birmingham, Ala., are at least four to eight times away from parity, while cities such as Montgomery, Ala., and Hinesville, Ga. have rates over 12 times off parity.
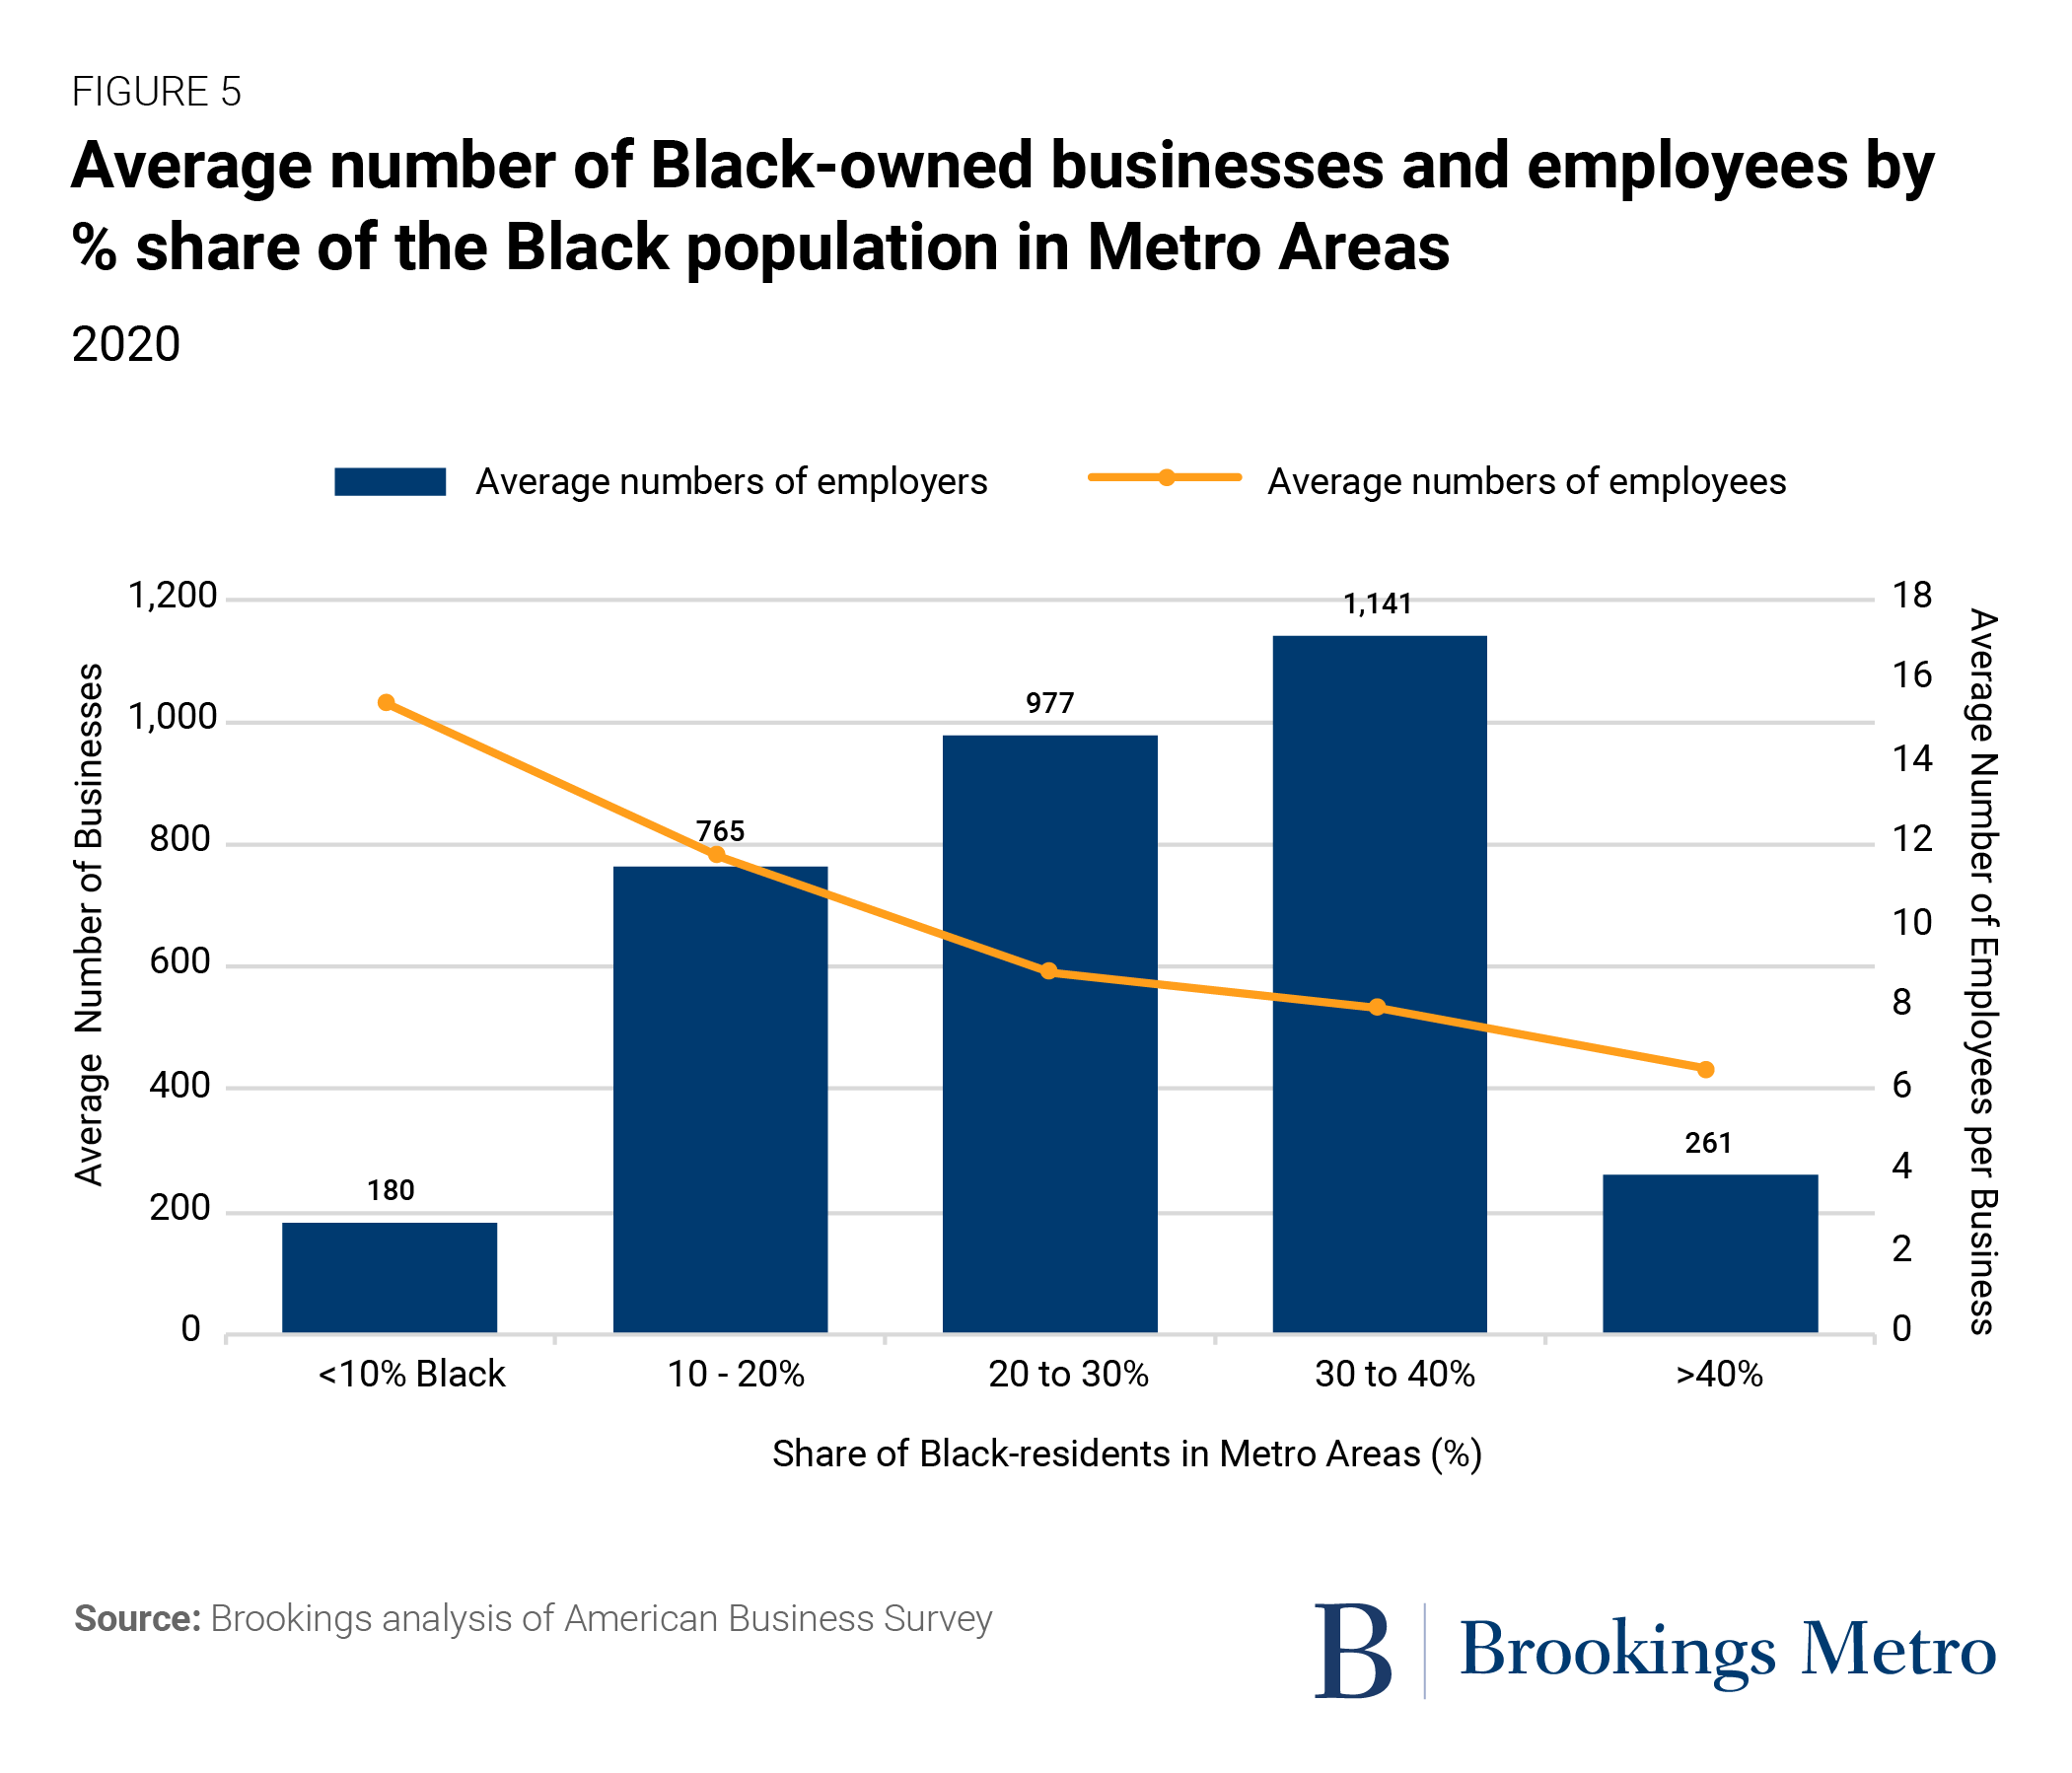
Figure 5 shows that the average number of Black-owned businesses sees a drastic decline for metro areas with Black population shares greater than 40%. This includes cities such as Jackson, Miss., Montgomery, Ala., and Albany, Ga. Moreover, as the share of Black residents increases, the average number of employees per business decreases—from an average of 16 employees in metro areas with a Black population share lower than 10%, to seven for metro areas with a Black population share greater than 40%.
These figures provide another indication that Black-owned businesses are not representative of their population size, especially in metro areas with the highest shares of Black residents. Moreover, the economic impact of the average Black-owned business tends to be smaller in metro areas with more Black residents. Taken together, these statistics highlight the continued underinvestment in Black-majority communities and regions—paralleling similar disparities we have documented in the absence of premium grocers and the lower value of commercial real estate in Black neighborhoods, even controlling for differences in income and wealth. This has implications for the capacity of locally owned Black businesses to generate inclusive growth and employment opportunities in their communities. Black-owned businesses tend to create more opportunities for people of color, and contribute to building more equitable regional economies.
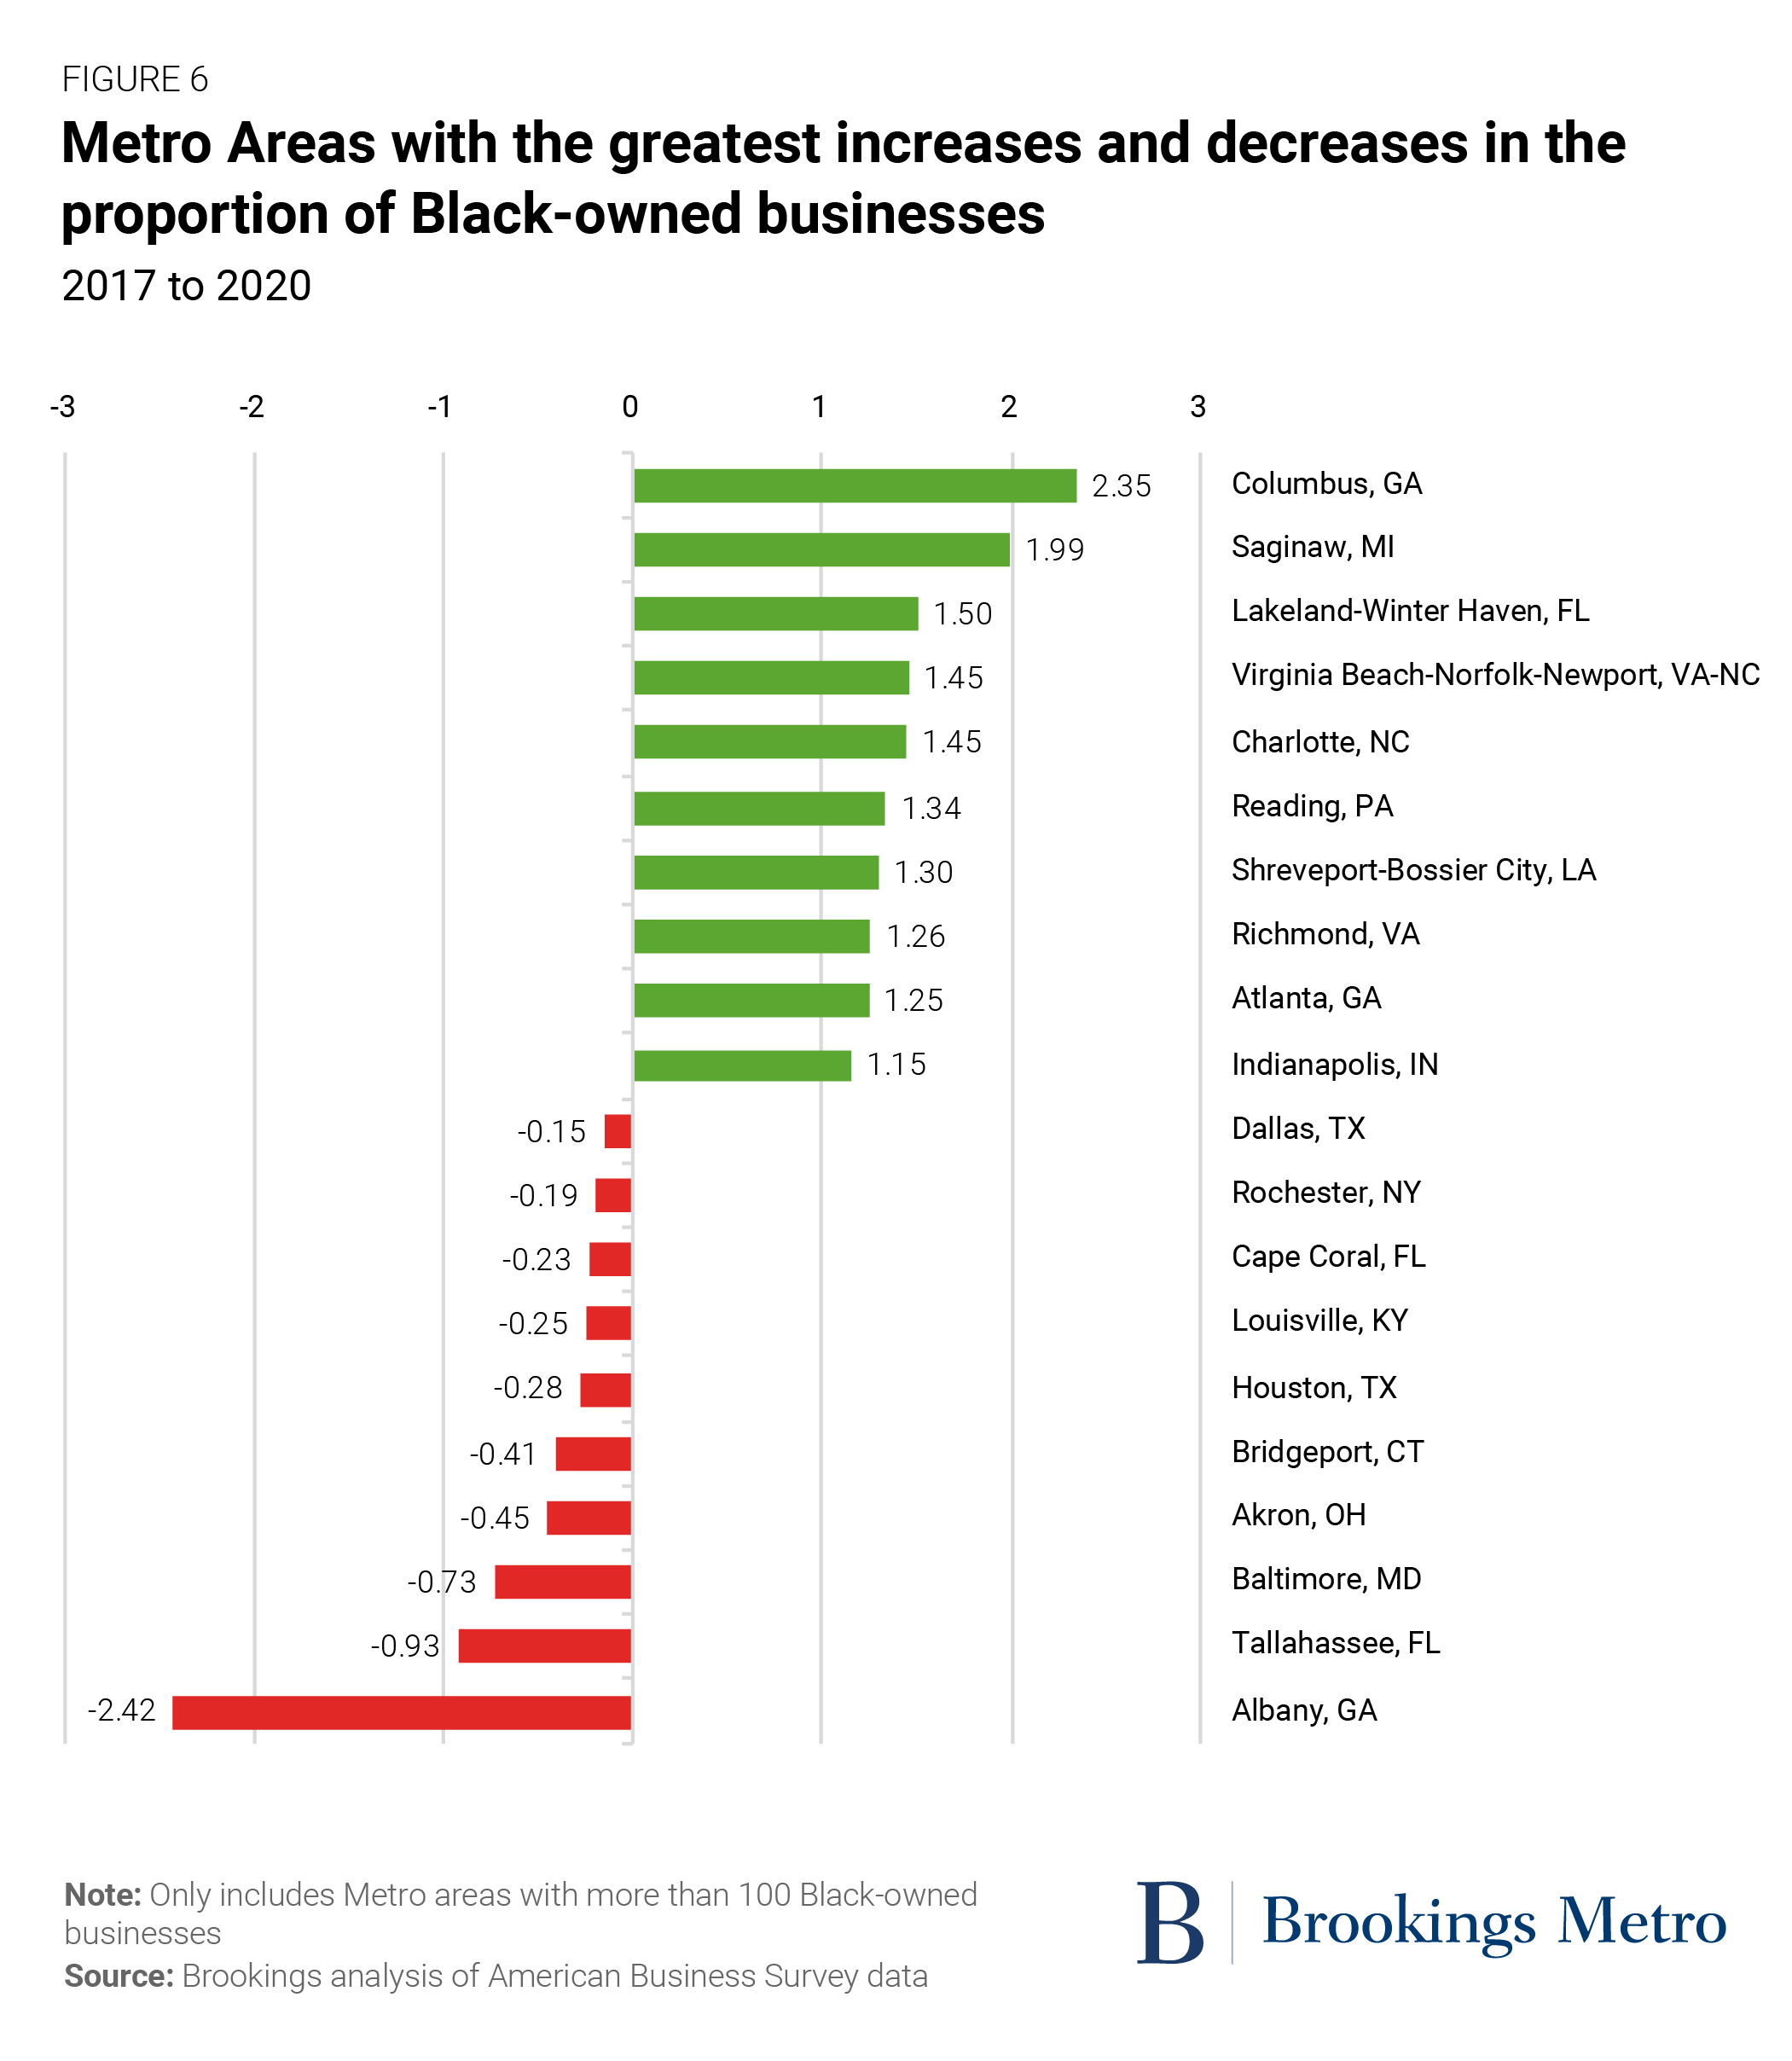
Looking across all survey years, the largest trends toward parity in business ownership occurred in Columbus, Ga., where the percentage of Black business ownership increased 2.35 percentage points. Albany, Ga. has seen the greatest decline, at 2.42 percentage points. Metro areas such as Columbus, Ga. and Virginia Beach, Va. have wealthy and stable markets and are located close to military bases. And the growth in areas such as Atlanta and Richmond, Va. align with other indicators of development in these areas, which show high rates of population growth and business development.
Progress in Black business ownership is variable between metro areas, with booming growth in upward trending areas and higher-than-average closure rates in declining areas. Figure 7 shows the fastest-growing and declining metro areas for the total number of Black-owned businesses, and compares growth between Black-owned and non-Black-owned businesses.
Most metro areas with high Black-owned business growth also have high total business growth, except Reading, Penn., New Haven, Conn., and Trenton, N.J., where Black business ownership has increased despite overall business declines. Similarly, areas with the largest declines in Black-owned businesses also have declines across all businesses. However, Black-owned businesses tend to be disproportionately impacted in these places, with much larger decreases in the number of Black businesses compared to the region’s average.
Map 1 shows an overall positive picture of growth for Black-owned businesses across the U.S., with high-growth areas in the Southeast and Southwest, but some pronounced declines in other areas, particularly the Midwest.
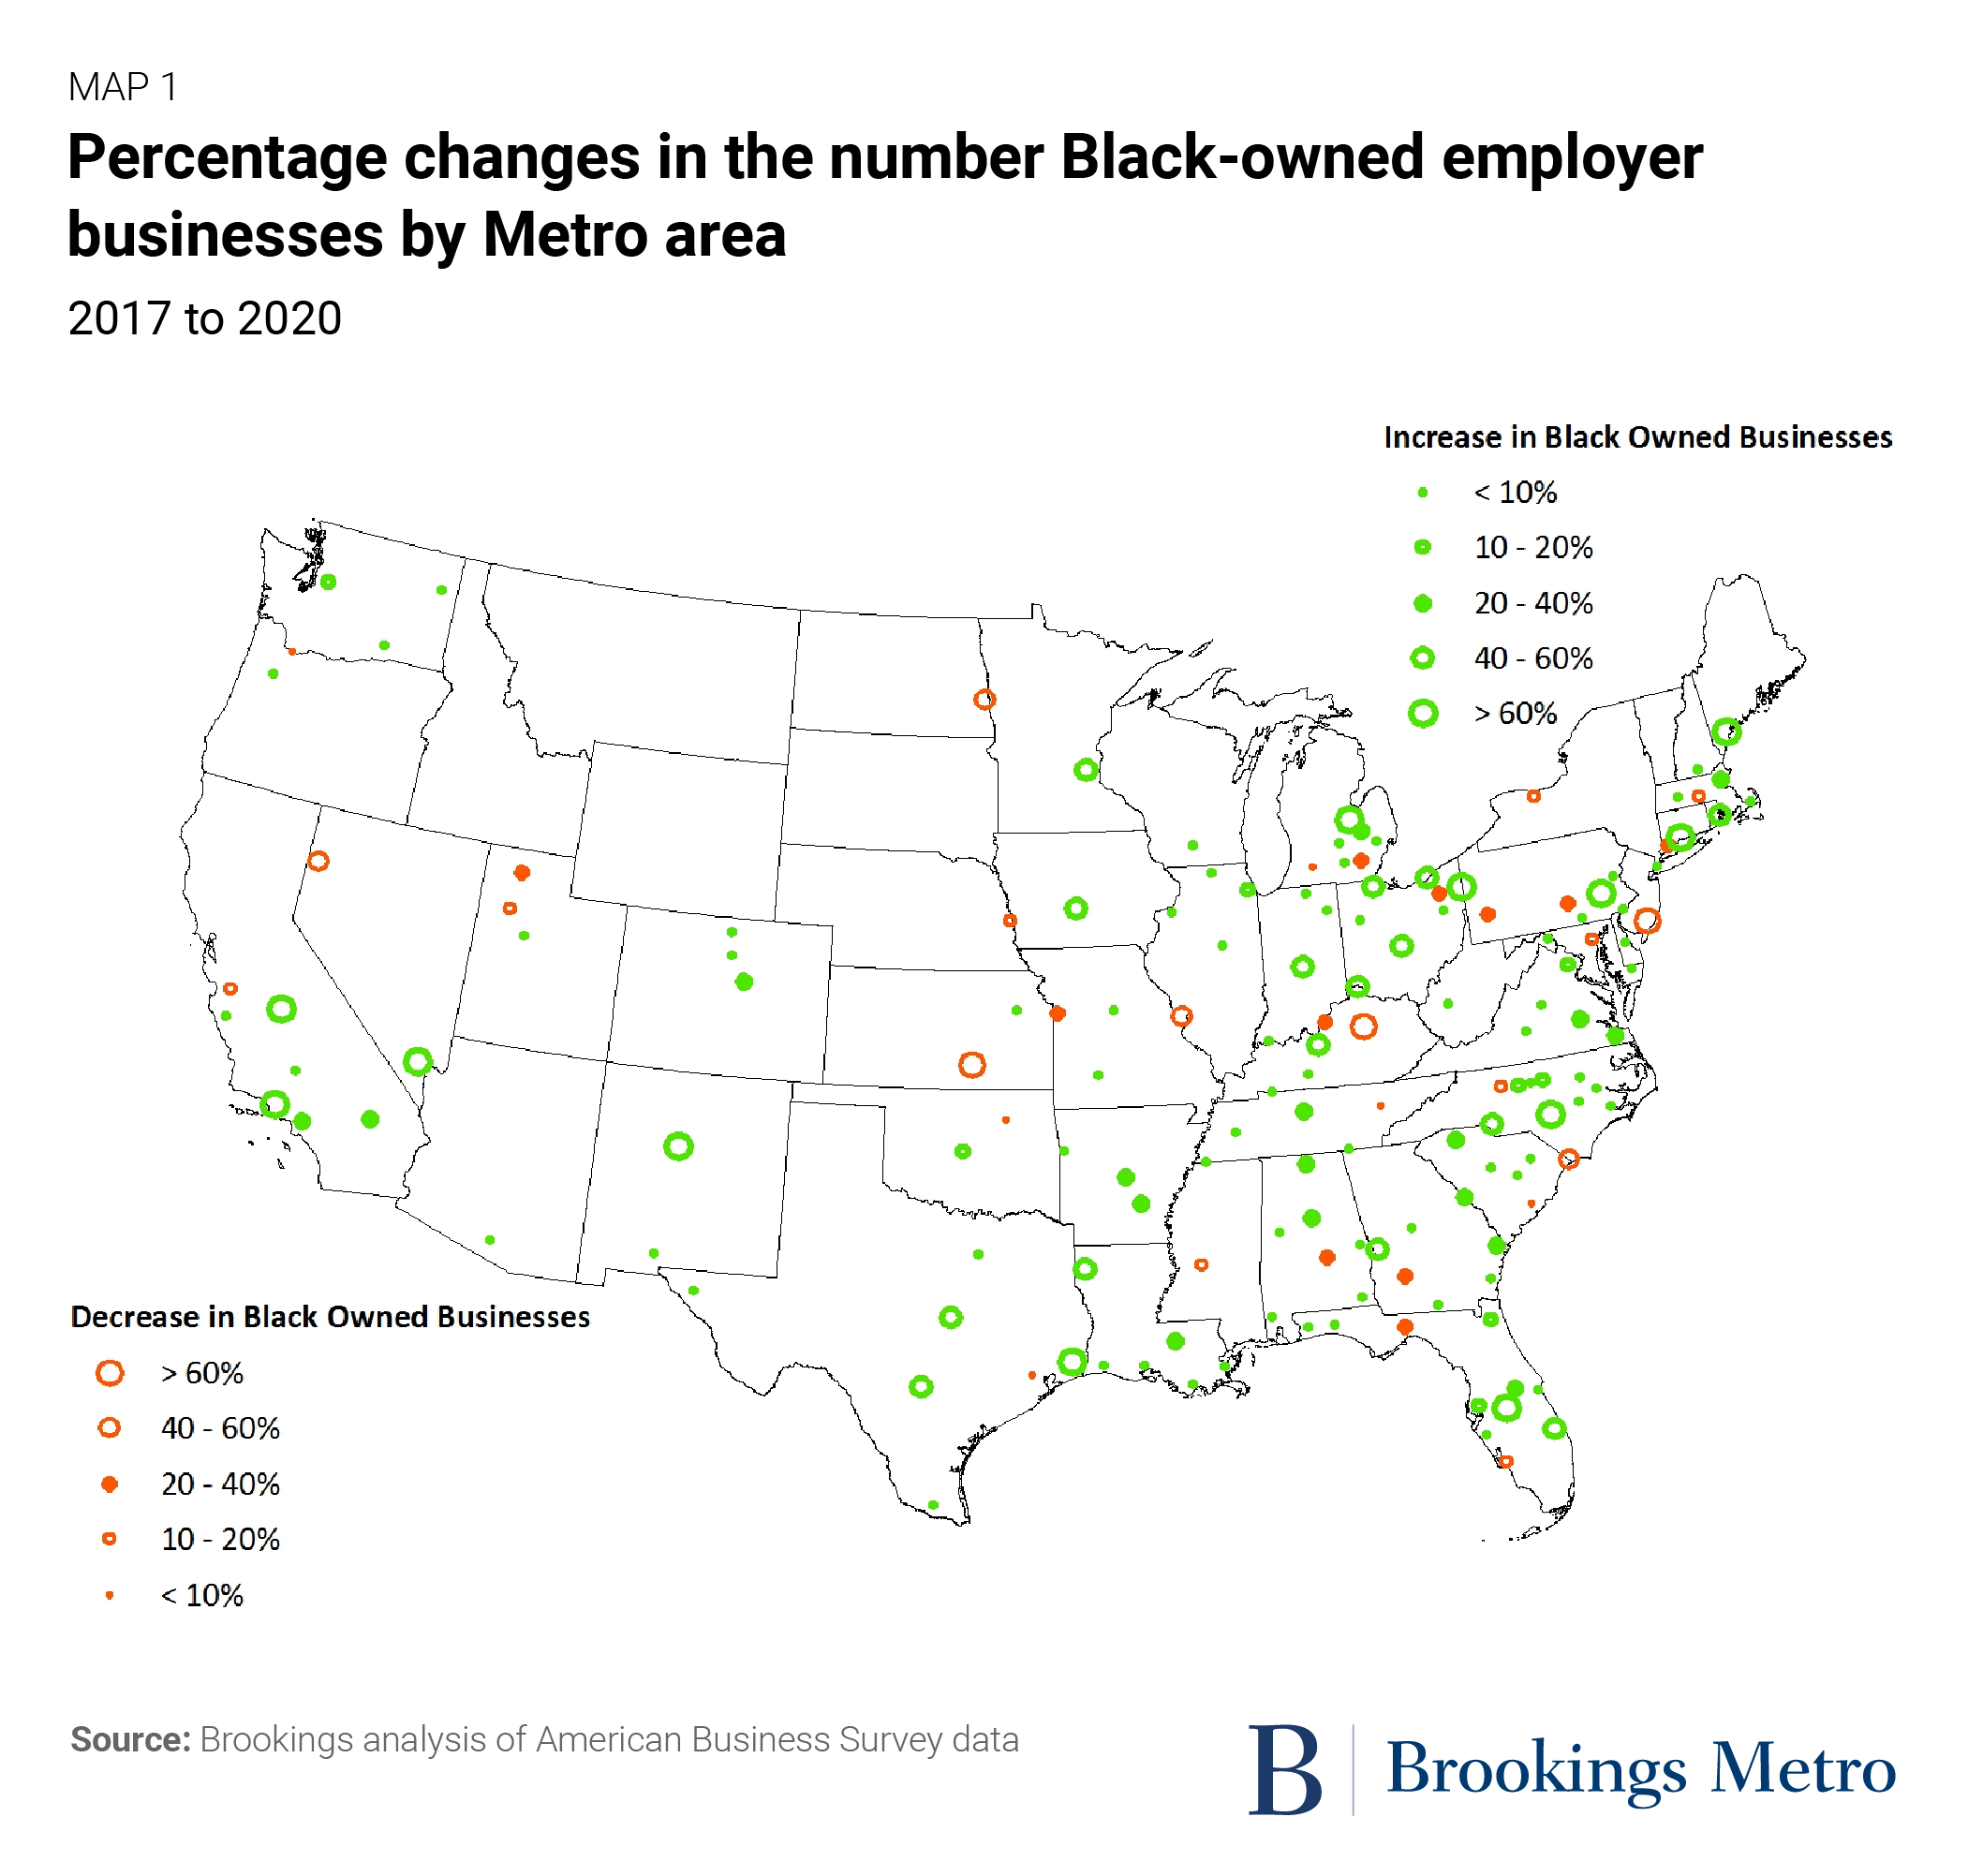
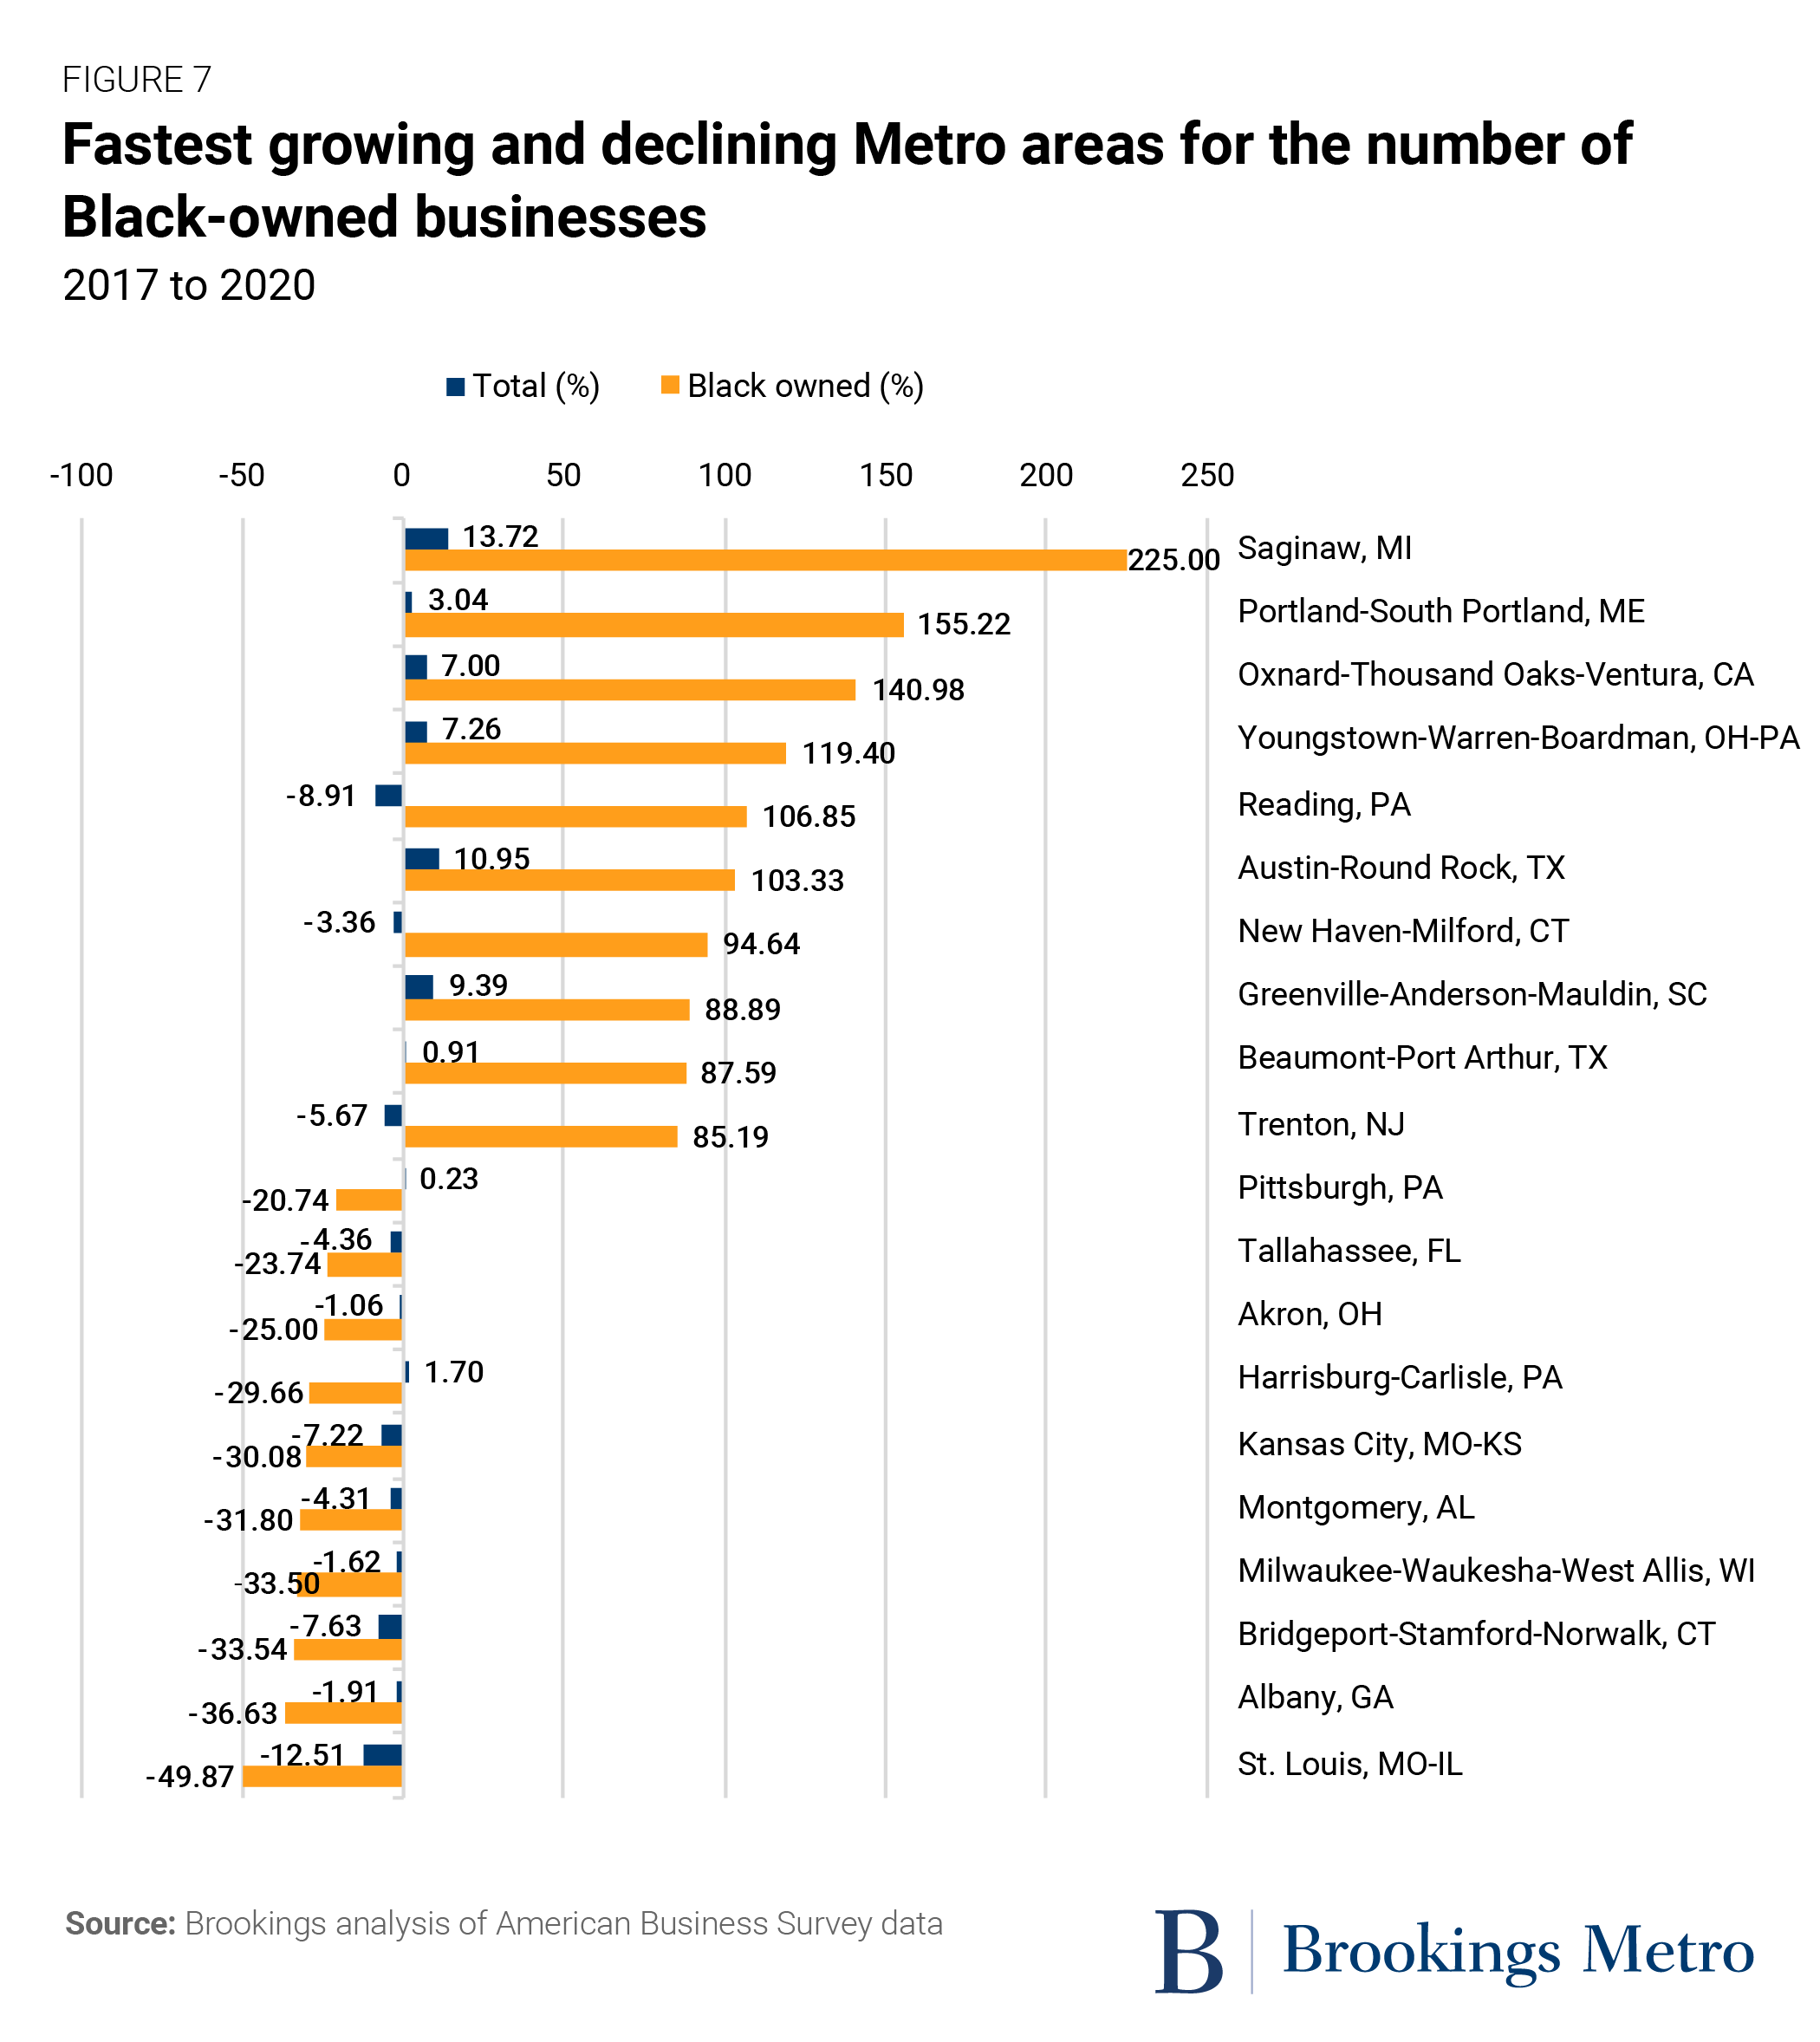
Figure 8 provides more detail on the variability Black-owned businesses experience in different metro areas. In some areas, Black-owned businesses are responsible for markedly high growth in overall business ownership. For example, in Washington, D.C. and Charlotte, N.C., Black-owned businesses accounted for 41.5% and 31.9% of total business growth, respectively. Conversely, in declining metro areas such as St. Louis and Milwaukee, Black-owned businesses have been highly impacted, representing 43.2% and 55.9% of the loss in regional businesses, respectively.
Black-owned businesses rebounded strongly from the pandemic
This report includes the first year of ABS data that captures the impacts of the COVID-19 pandemic on employer businesses. Our previous report used data from the Small Business Credit Survey (conducted between September and October 2020), which showed that the pandemic was disproportionately impacting Black-owned businesses. However, the 2021 ABS data on employer businesses—which captures the state of businesses over 2020—reveals strong rebounds for businesses overall, and Black-owned businesses in particular.
The pandemic initially hit new businesses hard, drastically reducing the rate of new business applications from January to April 2020. But by July, application rates had more than recovered, reaching numbers above those prior to the pandemic. From March 2020 to March 2021, new business applications rose by 73.9%, driven by increases in the South and Midwest, which saw jumps of 83.5% and 80.7%, respectively. As recently as February 2023, the rates of business applications remain high, indicating a sustained recovery.
However, the pandemic affected existing Black businesses in distinctive ways, dampening growth for some while buoying others. In addition to capturing the pandemic’s overall impact on employer businesses, the most recent ABS data reports subjective responses to the impact on business operations. Table 5 shows that a slightly smaller proportion of Black-owned businesses (3.9%, versus 4.1% for all businesses) were unable to maintain operations, while a higher proportion (36.2%, versus 29.7% for all businesses) were able to maintain operations with minimal impacts. However, a lower percentage of Black business owners reported they were able to maintain operations at or above current levels—reflecting the fact that though many Black employers were able to maintain operations, they may not have been able to take full advantage of the subsequent boom in businesses or recovery funds.
Black-owned firms were slightly more likely than all other businesses to report that sales decreased due to the pandemic (37.7% compared to 35.56%). The number of businesses impacted varied by firm size, with smaller and midsized employers less likely to report a decrease in sales than larger employers. However, Black-owned businesses were also more likely to report that sales increased due to the pandemic: An average of 12% of Black-owned businesses reported an uptick in sales, compared to only 5.5% of all businesses. These seemingly contradictory findings regarding sales demonstrate a great deal of variability among Black-owned firms. Some were more able to adapt and take advantage of the new economic environment while others were hit hard.
Closure rates by industry provide a more nuanced insight into the types of Black-owned businesses that were negatively impacted. Table 6 shows the percentage of Black-owned businesses and overall businesses by industry in 2020. Unsurprisingly, the hardest-hit industry for both groups was accommodations and food services, which saw revenues plummet during lockdowns, especially for Black-owned businesses. Black-owned businesses also saw slightly higher-than-average closure rates in the transportation and warehousing sector as well as the arts, entertainment, and recreation sector. These sectors are also large employers of Black people.
Black Americans had higher rates of job loss than other racial or ethnic groups during the pandemic. But in this regard, Black business owners’ decreasing “opportunity share” in 2020 (an estimate of the relative influence of opportunity over necessity in new business activity) shows that higher unemployment seems to have been a push factor for the decision to start a business.
Sectors that have high proportions of Black-owned businesses—including health care and professional, scientific, and technical services—were less impacted on average. Non-store retailers grew substantially over the first 40 weeks of the pandemic, and there is some evidence that COVID-19 relief funding was associated with higher rates of startups in higher-income Black-majority neighborhoods. Though a shift toward virtual businesses may have lowered the barriers to entry for Black owners, more work is needed to understand its effects on Black neighborhoods, where physical assets can help drive investment and growth.
An employer’s capacity to weather the pandemic partially depended on the ability of employees to work from home. According to the Bureau of Labor Statistics, in May 2020, 29.3% of Black employees were teleworking, compared to 35.4% overall. Teleworking rates were especially low for sectors in which Black employees were over-represented, such as health care, where only 1.7% of employees had the ability to telework.
Table 7 shows the proportion of Black-owned and non-Black-owned businesses that reported having employees who worked from home and those that reported having employees who never worked from home. Results varied by the age of the business. Newer Black-owned businesses seemed to have more flexibility for employees to work from home, especially those between four to five years of operation, while businesses over 10 years old were less flexible on average.
Table 8 shows some of the reasons that business owners gave for not having employees work from home. These are similar for Black-owned and non-Black-owned businesses, with slightly higher rates of Black employers citing security and IT concerns as a limiting factor. This may be a remnant of the differences in average revenue between Black-owned and other businesses, which may constrain investments in expensive remote work technology.
Black women are starting more businesses, but still lag in revenue and payroll
Between 2017 and 2020, the number of employer businesses owned by Black women rose to 52,374—encompassing 37.2% of all Black-owned businesses and representing an increase of 1.76 percentage points. Yet despite this growth, there is still significant progress to be made. Though Black women account for about 7% of the total U.S. population and 13.9% of American women, their businesses accounted for only 0.9% of total businesses and 4.2% of women-owned businesses in 2020.
Figure 9 shows how under-represented all women are in employer businesses, accounting for only 23.6% of the total share of owners. White women own 82.9% of these businesses (and 17.9% of all businesses). Latino or Hispanic women also have lower rates of business ownership, representing 18.5% of American women but only 6.8% of all female business owners, and about 1.8% of all business owners. Asian American women represent 6.3% of American women and 12.8% of female business owners, and around 3% of all business owners.
Figure 10 shows that revenue is distributed even more unevenly. Black-women-owned businesses represent 1% of all employer businesses, but bring in only 0.3% of total revenue—behind businesses owned by white women (11%), Asian American women (1.2%), and Latino or Hispanic women (0.6%). Figure 11 shows that most businesses owned by Black women make mid-level revenue (between $100,000 to $250,000 per year) and are over-represented in the lowest-earning categories (below $50,000 per year).
Though far from equitable, business ownership among Black women is growing rapidly. The number of Black-women-owned employer businesses increased by 18.1% between 2017 and 2020, outpacing women-owned businesses in general (9.1%) and Black-owned businesses (13.6%). These trends parallel the growth in small and sole proprietorships owned by Black and Latino or Hispanic women. These microbusinesses account for nearly 80% of all small businesses in the U.S., and could be a viable pathway to greater representation in employer businesses if we can create a supportive business environment for owners of color, and women in particular, to grow their businesses.
The extent to which these high growth rates are the result of structural changes in the business and lending sectors that have made room for more inclusive growth is questionable. For example, microbusinesses owned by women of color face unique structural barriers in access to microfinance, as well as opportunities for development and coaching. A closer scrutiny of these trends could help develop more intentional strategies to uplift these businesses and promote lasting growth by transitioning them into employer firms.
Ultimately, these disparities illustrate the still highly racialized and uneven business environment that women of color—and Black women in particular—face. These structural barriers are an impediment to the growing entrepreneurship among Black women. For example, 17% of all Black women in the U.S. are in the process of starting or running a new business, compared to 10% of white men and 15% of white women. In 2017, Black women owned over 19% of all women-owned businesses—above their proportional representation within the U.S. population. However, these businesses were much more likely to be sole proprietorships than employer firms, with eight out of 10 businesses owned by Black women being non-employer firms. Due to decades of racial discrimination and sexist loaning practices, Black women face more structural barriers in accessing capital, with about 61% of Black women self-funding their business and an higher-than-average level of debt. This is particularly the case for growing businesses, which face greater barriers to capital access than other businesses; only 3% of Black-women-owned companies survive longer than five years.
Structural factors, rather than an equitable business environment, seem to be driving growth in business ownership among Black women
A deeper look at the 2020 data adds nuance to the economic and structural factors that are driving higher rates of business creation for Black women, but also preventing the establishment of larger and more profitable businesses.
Table 9 shows that businesses owned by Black women are more likely to be a first business and less likely to be a primary source of income than the national average. Among Black-women-owned businesses, 50.8% are the owner’s first business—about 2.2% higher than the rate for all businesses and about 3% lower than the rate for all women-owned businesses. Additionally, 67.6% of Black-women-owned businesses are the owner’s primary source of income—about 3.3% lower than the average and 4.8% lower than male-owned businesses. In other words, employer businesses owned by Black women are more likely to be secondary to another income source, which limits the potential for business growth. This may be an indicator of larger economic trends that are leading people—especially low-income women—to supplement their income with multiple jobs to ensure financial security.
While on the one hand, these statistics illustrate that Black women are starting businesses at a higher rate than the national average, it also captures the ways that a lack of financial support and structural barriers in access to capital have resulted in Black business owners having a higher rate of failure for first businesses than the national average.
Most Black-women-owned employer businesses are in the health care and social services sector, which is also the largest sector for Black-owned businesses overall. Working in certain health care occupations in 2020 put Black women on the frontlines of the COVID-19 pandemic, meaning more than any other population, Black women were being exposed to and witnessing the gaps in our health care, economic, and political systems. Table 10 shows that in 2020, Black women started 5,364 health care businesses—the largest number by sector, followed by the professional, scientific, and technical services sector.
Qualitative data collected during the pandemic suggested that Black women were entering into health care to fill gaps left by federal and state policies, and the ABS data seems to confirm that. Despite often being the last to receive federal Paycheck Protection Program loans, there was a boom in Black women opening health care businesses to support their communities, which had higher COVID-19 death and morbidity rates.
The reasons that Black women choose to start businesses are varied, but structural pressures, such as poor job markets and a desire to help local communities, look to be crucial factors. Figure 12 shows that in 2020, 24.6% of Black women cited an inability to find work as a motivation to start a business—behind Black men (at over 27%), but 2.9% higher than the average rate and 6.8% higher than the rate for white women, who cited this reason the least. At the onset of the COVID-19 pandemic, an extreme drop in business revenues and stable employment struck Black communities at proportionally higher rates than most other racial groups. The inequity already baked into the economy—including in structural disparities in liquidity and credit—meant more Black-owned business closed quickly and permanently. Black workers suffered disproportionately from job loss, given their overrepresentation in frontline sectors such as health care and service industries.
Black women were also more motivated by a desire to help their community. Over 75% of Black women listed “wanting to help my community” as a key factor when deciding to start a new business. This is 15.5% higher than the average percentage for all businesses and over 18.3% higher than for white men, who were the least likely to cite this as an influential factor. The ABS data captures some businesses created in 2020, but includes a larger set of already established businesses from across the U.S. Thus, while these figures may be higher due to the disproportionate impacts of COVID-19 on Black communities, it also captures the realities of decades of structural racism limiting the economic opportunities for Black Americans.
Black women business owners tend to be younger and more educated than business owners of other groups, possibly illustrating the higher barriers that exist for Black women to access the capital and financial support needed to start a business, as well as the entrepreneurial drive among younger Black women. Figure 13 shows that most Black women business owners are 45 to 54 years old, compared to 55 to 64 for all businesses. Additionally, 6.6% are 34 years old or younger, compared to 5.7% for all businesses.
Table 11 shows that a comparatively substantial portion of Black women business owners (37.9%) have an advanced degree, including 19.1% with a master’s degree. This is more than 10 percentage points higher than the national average of 23.5%. This discrepancy indicates that the barriers to business ownership are still higher for Black women, who cannot receive equal economic support without earning more credentials.
On the other hand, these figures also highlight the role that highly educated Black women are playing in the growth of new employer businesses. Like in other arenas, including voter participation and community engagement, Black women are a potent force, helping to shape a more inclusive and innovative economy despite structural barriers. It is likely that decades of civil rights activism have paved the way for generational change—finally creating viable space for young, educated Black women to start businesses at such high rates.
Figure 14 shows how the economic and business environment has changed for Black women since the 1980s. The relatively small proportion of Black women who owned businesses pre-2008 is testament to the lasting impacts of racist policies on business longevity, which have lowered the security of Black businesses by blocking opportunities for household and community wealth retention, thus limiting the potential for sustained growth.
Most businesses owned by Black women today were started between 2013 and 2017, with the number growing since at least 2008, and at proportionally higher rates than other gender and racial or ethnicity groups. Conversely, businesses owned by white men and women are older, with proportionally more businesses started between 1980 and 2007.
In some respects, this illustrates the low survival rate for Black-women-owned businesses. However, the notable increases since 2008 could illustrate that greater numbers of Black women are seeing business ownership as a pathway to a more secure and stable livelihood, responding to increasingly precarious employment, financial, and housing conditions. Like during the pandemic, the post-2008 global financial economy involved heavy structural change, which undermined the stability of many low-income and Black and brown households. It may be that these structural factors—rather than improvements in racial equity—have driven the growth in Black-women-owned employer businesses.
California is booming for Black women business owners
Figure 15 shows that many of the fastest-growing areas for Black-women-owned businesses are in California. Between 2017 and 2020, the number of employer businesses owned by Black women grew by 93.14% in San Francisco (to 817 businesses); by 52% in Riverside (to 376 businesses); and by 44% in Los Angeles (to 2,310 businesses). Compared to Black men, the top metro areas for business growth for Black women are spread more evenly across the geographic regions of the U.S. Except for Los Angeles and Philadelphia, most of these large increases have occurred in cities with smaller total numbers of Black-women-owned businesses (fewer than 500).
In contrast, some of the largest declines in the number of Black-women-owned businesses have been in large eastern cities, including Hartford, Conn. and Baltimore, as well as some southern cities, such as Houston.
Table 12 displays Black women business owners as a proportion of all women business owners. It shows that seven of the top 10 metro areas are in the Southeast, including Memphis, Tenn. (15%); Jackson, Miss. (15%); and Atlanta (11%). St. Louis has the highest percentage of Black-women-owned businesses, at 21% of all women-owned businesses and 2,566 businesses in total. Most of these metro areas (except Durham, N.C.) also have higher percentages of Black-owned employer businesses.
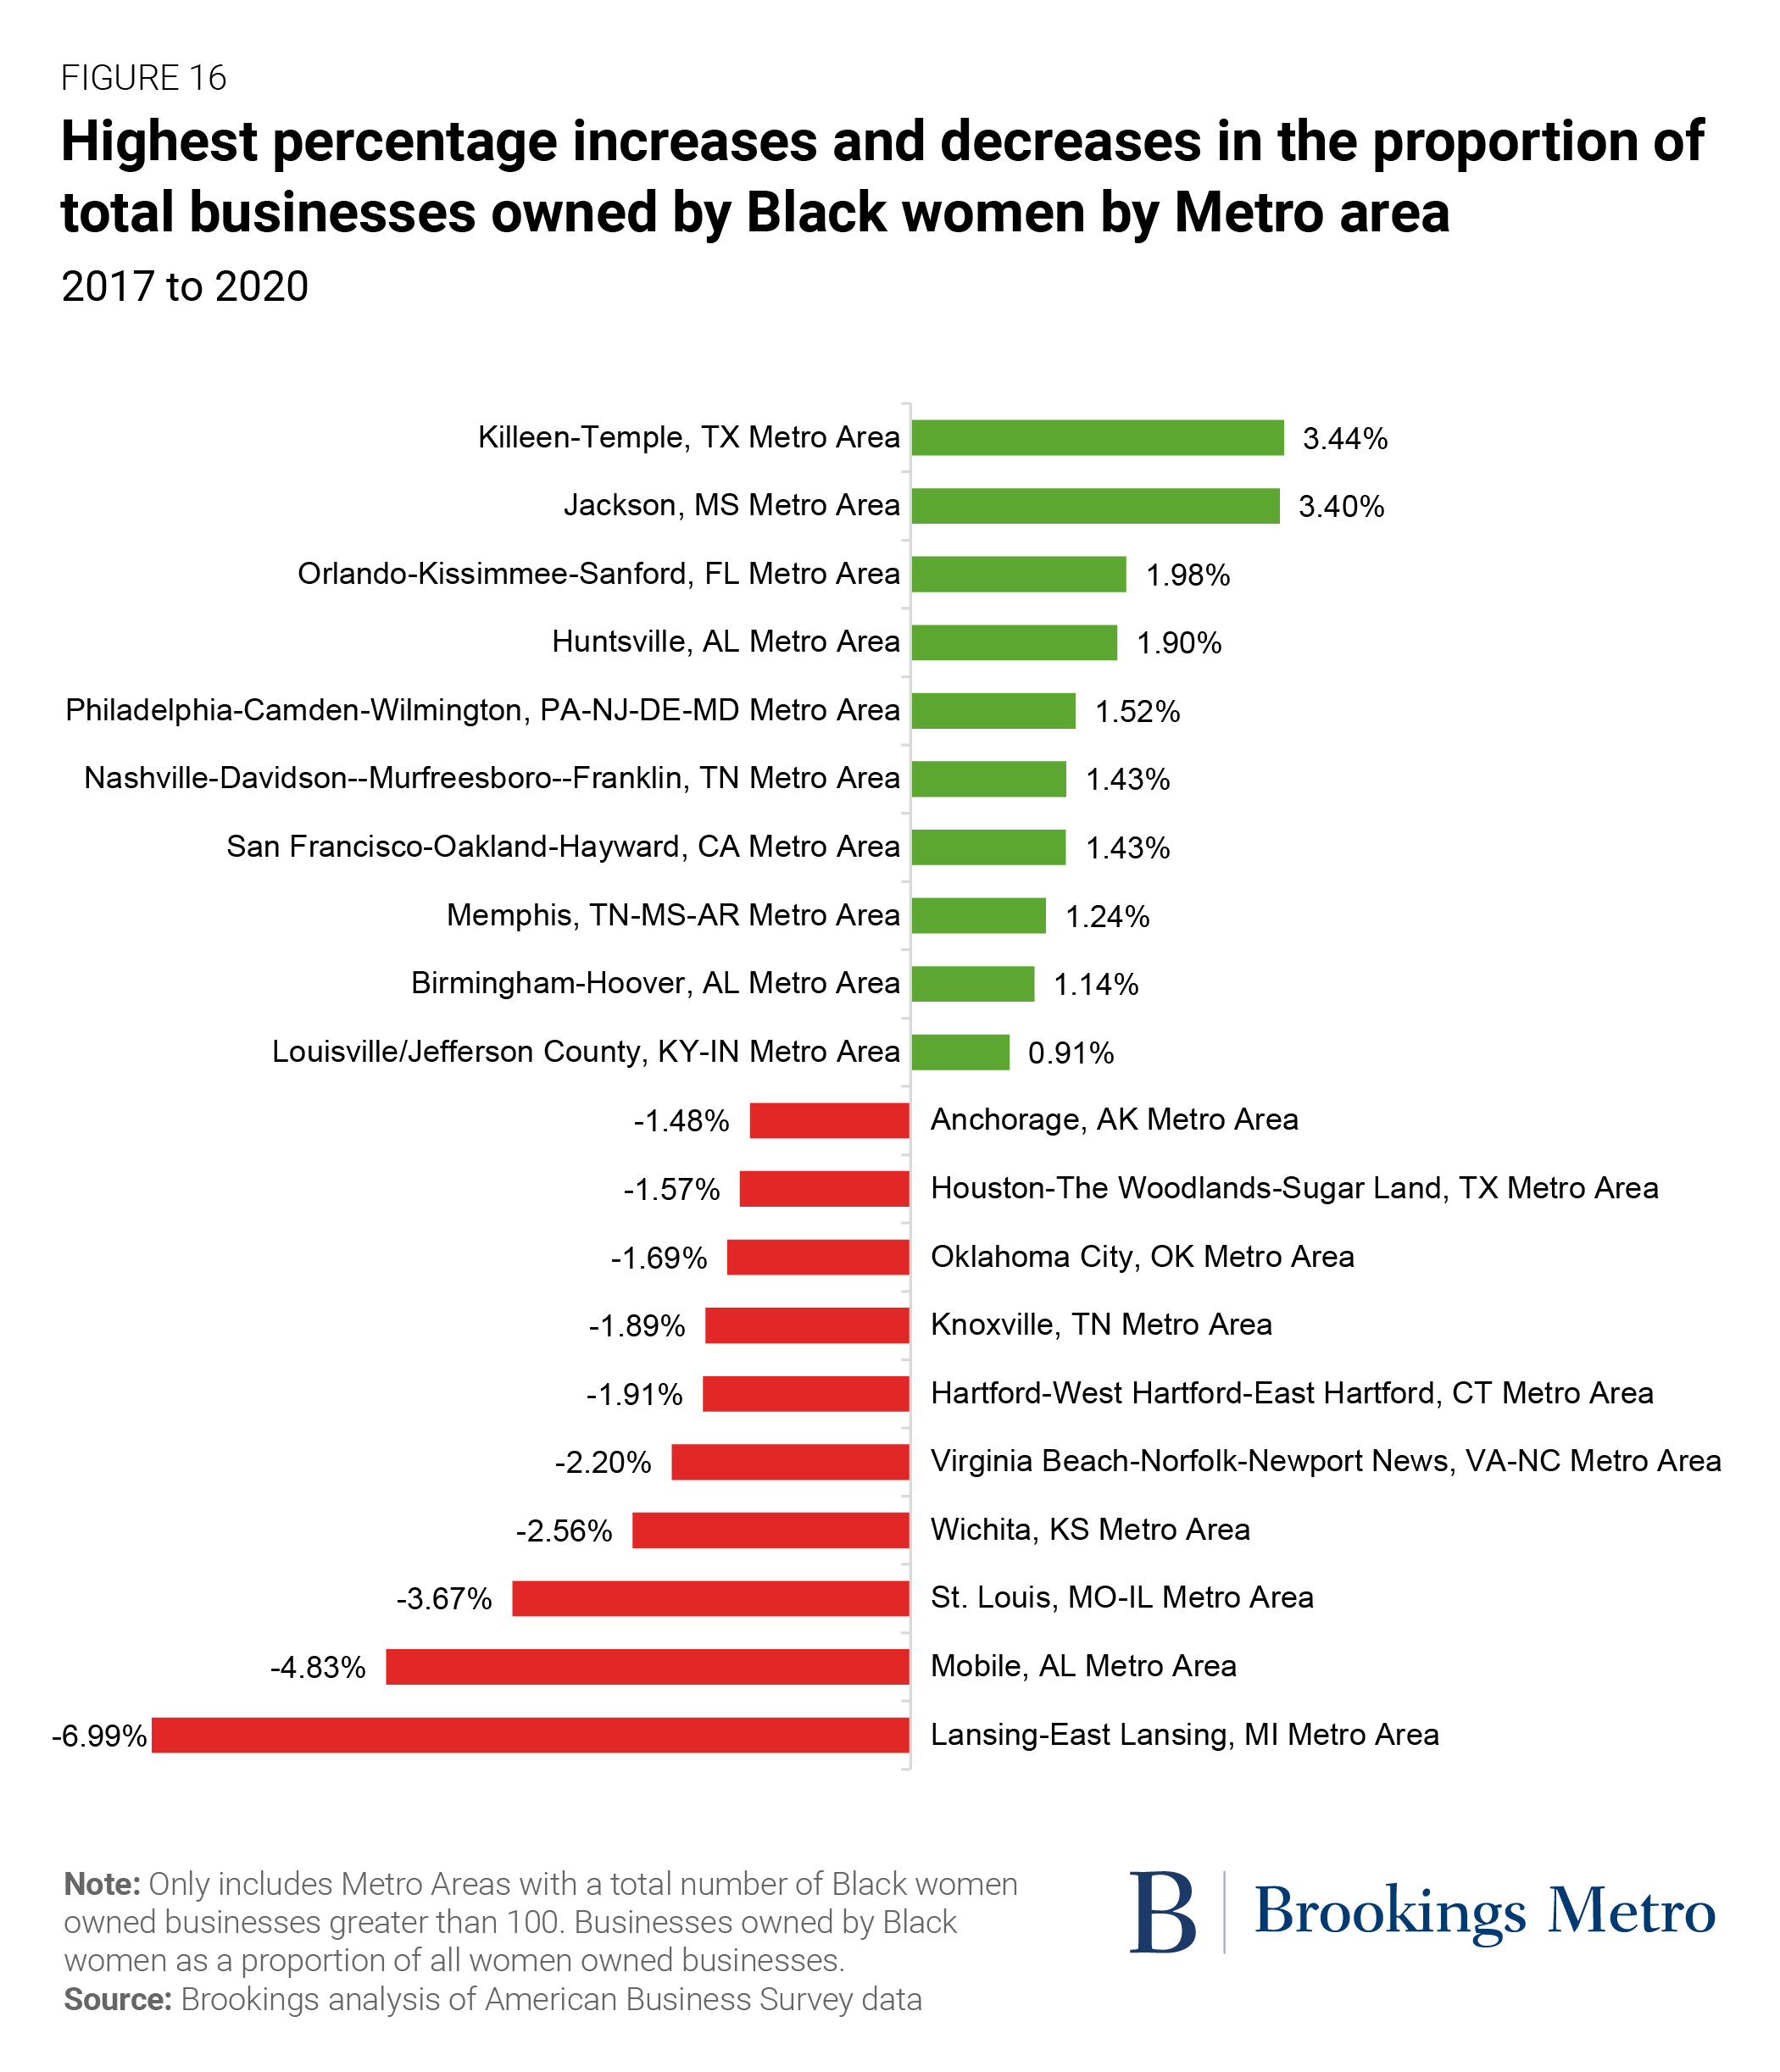
Figure 16 displays the percentage point changes in proportional representation for Black women employers. It shows that large southern cities—including Nashville, Tenn.; Memphis, Tenn.; and Birmingham, Ala.—are becoming more equitable, while Lansing, Mich.; Mobile, Ala.; and St. Louis have become more inequitable. Between 2017 and 2020, Killeen, Texas and Jackson, Miss. have had the largest shifts toward a more equitable rate of business ownership.
More action is needed to transform strong growth into lasting change
Looking across the data from 2017 to 2020, it’s clear that there has been substantial progress toward equal racial representation in owners of employer businesses. Black women in particular have made strides, with growth rates well beyond other racial, ethnicity, and gender groups. And this progress ought to be celebrated.
However, more action is needed to deliver lasting and transformative change toward a more inclusive economy. Realistically, these growth rates are well behind a pace that could ameliorate racial disparities in employer-firm ownership anytime soon, and large structural barriers across the economy—not least of which is the racialized nature of investments in place—continue to undermine transformative change.
Given that many of these disparities are structural in nature, the solutions must be as well. Past reports in this series have highlighted policy targets to expediate the growth in Black business ownership, including general targets and more pointed structural changes in federal funding and philanthropy, and we reiterate those here. While there are strong signs of real progress, if we are to translate gains and policy commitments into lasting change, we need to take seriously the notion that a more inclusive economy is a powerful vehicle for delivering a more robust and prosperous economy.
In this moment of historic federal funding across the innovation sector as well as in climate change adaptation and mitigation, the opportunities are ripe to invest in and grow Black business ownership, especially in historically underinvested areas. The Biden administration has shown a real appetite to act on racial justice, including guidelines (such as the Justice40 initiative and the executive order to strengthen racial equity) to ensure investments flow to historically disadvantaged communities. These systems must also be supported by local-level policy that can bend investments toward more equitable ends, including proactively forecasting how different racial groups will be impacted by how those investments are spent. This kind of active approach to structural change is necessary if we are serious about fostering and accelerating the development of Black-owned employer businesses.